IMPORTANT UPDATE MAJOR SOLAR ACTIVITY – LARGE CME HEADED FOR EARTH
Aug. 6, 2011 – CMEs, Geomagnetic Storms, Auroras, Solar Radio Bursts a Review of the Events So Far
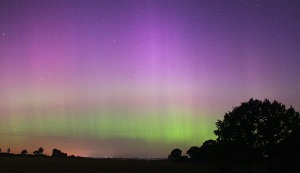 The CME strike on August 5th spawned one of the strongest geomagnetic storms in years. The magnetic disturbances rang the Earth like a bell and the magnetic field is still reverberating.
Spectacular aurora displays were seen across Europe and in many northern-tier US states.
Analysts at the Goddard Space Weather Lab say that the CME impact may have strongly compressed Earth’s magnetic field, directly exposing satellites in geosynchronous orbit to solar wind plasma.
Another rare phenomenon was triggered by the M9-class solar flare of August 4th – a rare below the horizon solar radio burst. The flare produced a burst of shortwave static so powerful that receivers on Earth picked it up after sunset. Amateur radio astronomer Thomas Ashcraft’s radio telescope in New Mexico recorded the event 1 hour and 54 minutes after sunset and is shown below.
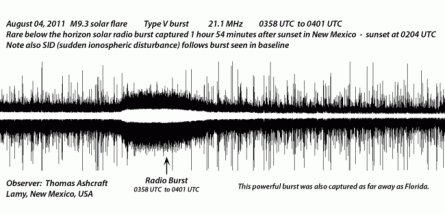 Nothing even remotely similar has been detected since the 1950’s. For more information on solar radio bursts click links below:
Report of an unusual solar radio burst that happened in 1958
Solar Radio Burst Classifications
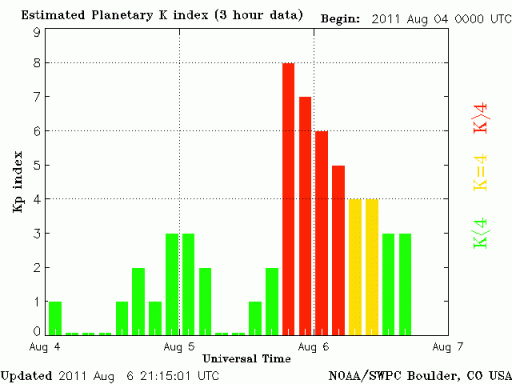
Another indication showing the severe nature of the storm is the K-index. The K-index quantifies disturbances in the horizontal component of earth’s magnetic field on a scale of 0-9 with 1 being calm and 5 or more indicating a geomagnetic storm. Geomagnetic storms have been associated with satellite surface charging and increased atmospheric drag.
Aug. 5, 2011 – 2nd Wave
CME Arrival Time: 2011-08-05 13:55:10.0 GMT (Aug 5 – 11:55 am edt)
Arival Time Confidence Level: ± 6 hours
Disturbance Duration: 5 hours
Disturbance Duration Confidence Level: ± 8 hours
Aug. 5, 2011 – 1st Wave
The first of three CMEs produced by the recent flare activity reached Earth during the late hours of August 4th. The impact was weak and did not produce strong geomagnetic storms – mostly level 1. Two more CMEs are still on the way and, as described below, they have merged into a single cloud that could produce significant storming when they reach Earth.
NASA is predicting that G3 (Strong) Geomagnetic Storm conditions are likely as well as a distinct chance of S2 (Moderate) Solar Radiation Storm levels being surpassed for the morning hours today.
G3 (Strong) Geomagnetic Storm Characteristics
Power systems: voltage corrections may be required, false alarms triggered on some protection devices.
Spacecraft operations: surface charging may occur on satellite components, drag may increase on low-Earth-orbit satellites, and corrections may be needed for orientation problems.
Other systems: intermittent satellite navigation and low-frequency radio navigation problems may occur, HF radio may be intermittent, and aurora may be been seen as low as Illinois and Oregon (typically 50° geomagnetic lat.)
S2 (Moderate)+ Solar Radiation Storm Characteristics
Biological: passengers and crew in high-flying aircraft at high latitudes may be exposed to elevated radiation risk.
Satellite operations: infrequent single-event upsets, possible noise in imaging systems, and slight reduction of efficiency in solar panel are likely.
Other systems: small effects on HF propagation through the polar regions and navigation at polar cap locations possibly affected.
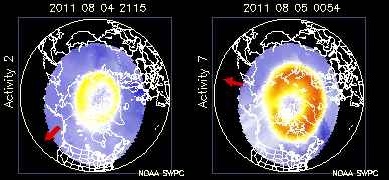
Even though this was a mild storm these views of the northern hemisphere shows a significant change in the charging intensity and distribution over a 4 1/2 hour period.
Aug. 4, 2011 Important Update!
For the third day in a row, sunspot 1261 has unleashed a significant M-class solar flare. The latest blast this morning registered M9.3 and would be major event on its own – but that ain’t all!
On August 3, the sun packed a double punch, emitting a M6.0-class flare at 9:43 am EDT and a slightly stronger M9.3-class flare at 11:41 pm EDT. Both flares had significant coronal mass ejections (CMEs) associated with them that will give the Earth a glancing blow.
The newest coronal mass ejection (CME) caused by the flare is expected to combine with one of the earlier and slower CMEs already headed in our direction.

Not to be outdone by the sunspots, a solar wind stream flowing from the indicated coronal hole should reach Earth on Aug. 7th or 8th
Analysts at the GSFC Space Weather Lab say the combined clouds should reach the Earth in two waves as follows:
CME Arrival Time: 2011-08-05 02:56:02.0 GMT (Aug 4 – 10:56 pm edt)
Arival Time Confidence Level: ± 6 hours
Disturbance Duration: 9 hours
CME Arrival Time: 2011-08-05 13:55:10.0 GMT (Aug 5 – 11:55 am edt)
Arival Time Confidence Level: ± 6 hours
Disturbance Duration: 5 hours
The impact on Earth is likely to be major.
Coronal mass ejections (CME’s) are dynamic events in which plasma which was initially contained on closed coronal magnetic field lines is ejected into interplanetary space.
CMEs interact with the Earth’s magnetosphere and ionosphere, and are responsible for enhanced auroral activity, satellite damage, damage to ground-based electronics, disruption of communication and some power station failures. This being an unusually large event expect any or all of these annoyances.
Still being debated are the possible biological effects of being exposed to these particles for the length of time expected. Adjust according to your needs and circumstance, but don’t ignore this one.
Mass ejections create these disturbances by driving interplanetary shock waves and accelerating particles to relativistic speeds, all of which come “crashing” into the earth’s magnetic environment. There are 50 to 60 billion tons of charged particles bearing down on us.
Click here to see a NASA animation showing the 3 CMEs combining and blasting the Earth.
Click here here to see video of CME erupting from the sun.
To see a previous Pstuph article with more information on CMEs click here.
Aug. 2, 2011
A solar wind stream is currently pummeling Earth’s magnetic field and causing increased geomagnetic activity around the poles. The peak so far has been a G1-class storm that lasted for several hours around the end of July 30th.
The solar wind is the supersonic outflow into interplanetary space of plasma from the Sun’s corona, the region of the solar atmosphere beginning about 4000 km above the Sun’s visible surface and extending several solar radii into space.
There are also multiple active sunspots in play. The magnetic fields of sunspots 1261 & 1263 contain energy for powerful X-class solar flares. Double sunspot 1263 is unusually large. Its two dark cores are each wider than Earth, and the entire region stretches more than 65,000 km from end to end.
A solar flare is an explosion on the Sun that happens when energy stored in twisted magnetic fields is suddenly released. Flares produce a burst of radiation across the electromagnetic spectrum, from radio waves to x-rays and gamma-rays.
Strong Class X flares can bathe the Earth in high doses of ultraviolet radiation and X-rays, hurling huge bursts of solar wind in our direction. When these bursts arrive at our planet, the electrons and protons from the solar wind come into contact with Earth’s magnetic field, and stream toward the magnetic poles.
These types of disturbances can create geomagnetic storms in Earth’s magnetic field.
There are 3 categories scientists use to classify solar flares :
X-class flares are big; they are major events that can trigger planet-wide radio blackouts and long-lasting radiation storms. M-class 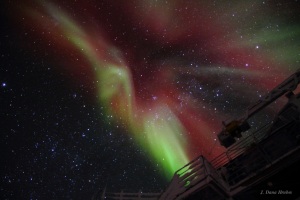 flares are medium-sized; they can cause brief radio blackouts that affect Earth’s polar regions. Minor radiation storms sometimes follow an M-class flare. Compared to X- and M-class events, C-class flares are small with few noticeable consequences here on Earth.
A powerful flare erupted from the sun this past weekend. The M9-class flare erupted from 1261, but was not oriented in Earth’s direction causing little effect.
Because the sunspot is now turning to face Earth, any such eruptions in the days ahead would likely effect the Earth causing communications disruptions and spectacular auroras.
This has been a busy year for the sun. To see a previous Pstuph article from April where the sun behaved in a similar manner click here.
SUN’S-A-POPPIN’ AND POINTIN’ OUR WAY
Newly arriving data from NASA’s STEREO probes suggest that a coronal mass ejection (CME) might be heading toward Earth. The source of the cloud appears to be sunspot complex 1185-1186, which experienced an episode of magnetic instability during the early hours of April 9th and again on the 10th.
Since April 7th the active region has hurled massive clouds into space. High latitude sky watchers should be alert for auroras. NOAA forecasters estimate a 40% chance of geomagnetic activity during the next 48 hours, when a solar wind stream is expected to buffet Earth’s magnetic field.
This movie to the right shows a spherical map of the Sun as it currently appears, formed from a combination of the latest STEREO Ahead and Behind beacon images, along with an SDO/AIA image in between. The movie starts with the view of the Sun as seen from Earth, with the 0 degree meridian line in the middle. The map then rotates through 360 degrees to show the part of the Sun not visible from Earth.
 STEREO consists of two space-based observatories – one ahead of Earth in its orbit, the other trailing behind. With this new pair of viewpoints, scientists are able to see the structure and evolution of solar storms as they blast from the Sun and move out through space.
There are two kinds of solar storms, often related to each other: coronal mass ejections (CMEs) and solar flares.
A flare occurs when magnetic energy builds to a peak near the Sun’s surface and explodes. This intense, fast-paced event results in an intense burst of light, including X-rays, in the Sun’s lower atmosphere.
A much larger storm, a CME erupts when magnetic field lines snap, sending billions of tons of material into space at millions of miles per hour. The cloud expands to over 30 million miles by the time it reaches Earth. Both flares and CMEs can result in additional high speed particles being shot out into the solar system at close to the speed of light.

A side-by-side comparison of the Sun from precisely two years ago (left, from SOHO) to the present (right, from Solar Dynamics Observatory) dramatically illustrates just how active the Sun has become. Viewed in two similar wavelengths of extreme ultraviolet light, the Sun now sports numerous active regions that appear as lighter areas that are capable of producing solar storms. Two years ago the Sun was in a very quiet period (solar minimum). The Sun’s maximum period of activity is predicted to be around 2013, so we still have quite a ways to go.
Click here to see the a composite of latest NASA LASCO C2 coronal images. Covering April 4-10, the GIF animation shows an amazing display of CME activity starting on April 7. This is a large file but worth downloading.
When the ejection is directed towards the Earth and reaches it as an interplanetary CME (ICME), the shock wave of the traveling mass of solar energetic particles causes a geomagnetic storm that may disrupt the Earth’s magnetosphere, compressing it on the day side and extending the night-side magnetic tail. When the magnetosphere reconnects on the night side, it releases power on the order of terawatt scale, which is directed back toward the Earth’s upper atmosphere.
This process can cause particularly strong auroras in large regions around Earth’s magnetic poles. These are also known as the Northern Lights (aurora borealis) in the northern hemisphere, and the Southern Lights (aurora australis) in the southern hemisphere. Aurora appear from Earth as shimmering, dancing lights in the night sky. Although green is the most common color, red and yellow hues are also observed.

A coronal mass ejection observed April 10 by the SOHO spacecraft heralds the approach of an active region to the Earthside of the sun. The source of the blast is currently located behind the sun’s northeastern limb, but solar rotation will turn it in our direction in the days ahead.
Coronal mass ejections, along with solar flares of other origin, can disrupt radio transmissions and cause damage to satellites and electrical transmission line facilities, resulting in potentially massive and long-lasting power outages.
Humans in space or at high altitudes, for example, in airplanes, risk exposure to intense radiation. Short-term damage might include skin irritation. Long-term consequences might include an increased risk of developing skin cancer.
More information:
NOAA Space Weather Prediction Center
The Very Latest SOHO Satellite Images
Regional Warning Center Sweden of International Space Environment Service
FEARMONGERS SPREAD Xe-131 PANIC – SAY IT BLANKETS US
It has recently been reported in a number of blogs that Xe-131 has “blanketed” The US. There is enough to worry about during this event and Xenon is not one of them.
Pacific Northwest National Laboratory measured and reported the Xenon. Their lab has the most sensitive instrument in the world measuring specifically for Xenon around-the-clock. They are set up to provide Nuclear Test Treaty verification. They are not set up to warn for un-healthful levels during a radiation event.
Here is a report from the lab that first measured the very miniscule levels. PACIFIC NW LABS XENON-131 STATEMENT
Most of the “articles” include a moving map from WeatherOnline as proof of the blanket of Xe-131 covering us all. These are predictive dispersion models of where radioactive isotopes might go if they were in the atmosphere at that time. They are basically weather maps – not radiation predictors and should be treated as such.
Here is a disclaimer from the WeatherOnline website to amplify my assertion: “ATTENTION: These products are highly uncertain based on limited information for the source terms. Please use with caution and understand that the values are likely to change.”
XENON-131 FACTS FROM MATERIAL DATA SAFETY SHEET
PHYSICAL CHARACTERISTICS:
HALF-LIFE: 5.29 days
Hazard category: C- level (low hazard ) : 0.100 to 10 mCi
B – level (Moderate hazard) : > 10 mCi to 1000 mCi
A – level (High hazard) : > greater than 1000 mCi
EXTERNAL RADIATION HAZARDS AND SHIELDING:
The gamma exposure rate at 1 cm from 1 mCi of Xe133 shielded for betas is 150 mR/hr, and at 1 foot will be 0.17 mR/hr. The half and tenth values of lead for this gamma are 0.003 and 0.015 cm respectively. This means that lead sheets or regular lead shipping pig will be sufficient for shielding the material.
The maximum range of the betas is about 0.002 inches in lead. Therefore, the use of the lead shield for storage will provide adequate shielding for the beta particles. If skin is uniformly contaminated with Xe133, 1 microcurie /cm2 deliver a dose of 4200 mrems/hr to the basal cells of the skin.
HAZARDS IF INTERNALLY DEPOSITED:
It is important to avoid ingestion, inhalation and/ or skin contamination.
The NCRP MPC for Xe133 is 10E-5 uCi/ml for 40 hr/wk.
SPECIAL PROBLEMS AND PRECAUTIONS:
1. Xe133 is heavier than air and hard to be kept in solution form, therefore, one should work in well ventilated areas.
2. Survey frequently. Change gloves often.
3. Limit of soluble waste to sewer: 100 microcuries per day per lab
Can Ocean Currents Transport Radioactive Materials To The US?
We know that in the days after the Fukushima nuclear plant began releasing radioactive materials into the atmosphere, all of the “weather readers” on the networks and local channels appeared to be reading from the same script. Soon after “experts” were paraded in front of the camera to dismiss the possibility. We all know now that they were dead wrong!
Examples of this:
March 15, Dr. Perry Kendall (public health officer – British Columbia) said, “winds from Japan take five or six days to reach B.C. and by then any radioactive particles would have dispersed over the Pacific Ocean.“
“Japan has an evacuation area of about 12 miles from the nuclear plants. Washington state is 5,000 to 6,000 miles away from Japan,” Tim Church, a spokesman for the Washington State Department of Health, told the Wall Street Journal in a March 15th article.
March 18, a Baltimore Sun article stated, “There’s just one problem with all this panic: It’s completely irrational. Nuclear radiation can extend around 12 miles from the point of meltdown — not 12-friggin’-thousand miles. ”
“Worst-case scenario, there is no threat to public health in California,” said the California Emergency Management Agency Secretary Mike Dayton.
“Based on the type of reactor design and the nature of the accident, we see a very low likelihood — really, a very low probability — that there’s any possibility of harmful radiation levels in the United States or in Hawaii or any other U.S. territories,” Nuclear Regulatory Commission Chairman Gregory Jaczko stated .
And now that it is here they are all now saying that the levels aren’t harmful.
What I haven’t heard discussed much is whether or not the massive amounts of material flowing into the Pacific Ocean can make it to the US shores.
Fig. 1 is a map of the ocean currents in the Pacific. Much like the jet stream, gulf currents follow fairly predictable seasonal paths.
As you can see, just as with the jet stream there is ample opportunity for ANY material to be transported thousand of miles.
Recently in Bloomberg Business Week, Ken Buesseler, senior scientist at Woods Hole Oceanographic Institute in Massachusetts said, “The ocean can absorb significant increases in cesium and iodine, the two most common radioactive isotopes coming from the plant, before it becomes unsafe for humans or marine animals.”
“For cesium and iodine, they are soluble,” Buesseler said “This time of year off the coast of Japan, they would mix with water down 100 feet to 300 feet, and be diluted by a factor of about 100. The currents there would move it to the south, just north of Tokyo, and then out to sea.”
OUT TO SEA???? AND THEN WHERE???
More to come on this issue in a latter post.
FUKUSHIMA TOOLKIT
Complied by Webworker
Here is a list of resources that will aid in understanding of the current nuclear emergency
================================================
DAILY YOMIURI ONLINE
Japan’s leading English-language newspaper–is published by The Yomiuri Shimbun which has the largest circulation of any newspaper in Japan. The Daily Yomiuri is an excellent source of both domestic and foreign news.
www.yomiuri.co.jp/dy/index.htm
==================================================
THE JAPAN TIMES
In addition to economic, political, sports and hard news, other information includes commentaries from opinion leaders in various fields and editorials that reflect Japanese public opinion.
www.japantimes.co.jp/news.html
==================================================
YOKOSO NEWS -TV
Television feed of Japanese man named “ Katz” reading and interpreting Japanese news sources in English. Very good info here.
www.ustwrap.info/show/yokosonews
=================================================
NHK WORLD TV – English Language
NHK operates international television, radio and Internet services in Japan. Together, they are known as NHK WORLD. This is their English language feed.
www3.nhk.or.jp/nhkworld/r/movie/
=================================================
RT (Russian Television)
24 hr news and commentary from a Russian perspective.
www.rt.com/on-air/
=================================================
TEPCO
Official Tokyo Electric & Power Company English language site. Press Releases and periodic Main Gate readings are published here.
www.tepco.co.jp/en/index-e.html
=================================================
PRESS TV (Iran)
Press TV is the first Iranian international news network, broadcasting in English.
www.presstv.ir/live/llnw/
=================================================
KYODO NEWS
Japans Leading News Network (self-proclaimed)
english.kyodonews.jp/news/japan_nuclear_crisis/
=================================================
UNLV AIR RADIATION TEST RESULTS
UNLV Health Physics department has set up a high-volume air sampler on the roof of the Bigelow Health Sciences building in an attempt to measure radionuclides released from the Fukushima Daiichi accident in Japan.
http://www.ansatunlv.com/air_monitoring.html
=================================================
UNIVERSITY OF WASHINGTON PHYSICS DEPT quickly adapted one of their basic research labs to monitor for the arrival of trace amounts of fission products produced at Fukushima.
http://www.npl.washington.edu/monitoring/node/1
=================================================
JET STREAM AND WEATHER MAPS/FORECASTS
The California Regional Weather Server’s weather maps and images are created at San Francisco State University using data from the National Weather Service.
squall.sfsu.edu/crws/jetstream.html
==================================================
UNIVERSITY OF MD. PLUME FORECASTS
University of Maryland atmospheric science researchers are publishing atmospheric dispersion patterns using a tool developed by the National Oceanic and Atmospheric Administration (NOAA) – the HYSPLIT model.
http://www.atmos.umd.edu/~tcanty/hysplit/
==================================================
Japan 2011 Earthquake/Tsunami U.S. Government Information
Official US Gov with information on air quality, food safety, Americans in Japan, disaster preparedness, and donations.
www.usa.gov/Japan2011.shtml
==================================================
Centers for Disease Control and Prevention
This site provides information to help people protect themselves during and after a radiation event.
www.bt.cdc.gov/radiation/
==================================================
EPA RADNET (public site)
EPAs nationwide radiation monitoring system, RadNet, continuously monitors the nations air and regularly monitors drinking water, milk and precipitation for environmental radiation. The RadNet system consists of both fixed and deployable monitors. To see data from an individual monitor click on the monitor in that state.
www.epa.gov/rpdweb00/rert/radnet-data-map.html
==================================================
