21 Examples Of Government Waste – All From The EPA
From The EPA’s Envirofacts Site – RadNet Overview
“RadNet is a national network of more than 200 monitoring stations distributed across all 50 states and the American Territories. These stations regularly sample the nation’s air, precipitation, drinking water, or pasturized milk for a variety of radionuclides.
RadNet normally samples radiation in all media on a regularly defined schedule. In the event of a threat of a significant radiation release RadNet typically will increase the frequency of sampling and generate many more data records for a given period of time compared to its routine operation.
RadNet data provides a means to estimate levels of radioactivity in the environment, including background radiation as well as radioactive fallout from atomic weapons testing, nuclear accidents, and other intrusions of radioactive materials. RadNet also provides the historical data needed to estimate long-term trends in environmental radiation levels.”
THEN WHERE’S THE DATA?
For more information on the EPA’s Failed RadNet radiation monitoring system click on the two stories below:
RadNet or SadNet? The EPA’s Failed Radiation Detection System
Current EPA Rainwater & Milk Radiation Data
LATEST RESULTS UPDATED DAILY
Scientists Say NO SAFE LEVEL of Radiation
According to the National Academy of Sciences, there are no safe doses of radiation. Decades of research show clearly that any dose of radiation increases an individual’s risk for the development of cancer.
“There is no safe level of radionuclide exposure, whether from food, water or other sources. Period,” said Jeff Patterson, DO, immediate past president of Physicians for Social Responsibility. “Exposure to radionuclides, such as iodine-131 and cesium-137, increases the incidence of cancer. For this reason, every effort must be taken to minimize the radionuclide content in food and water.”
The father of Health Physics, Dr. Karl Morgan stated, “There is no safe level of exposure and there is no dose of radiation so low that the risk of a malignancy is zero”
“Consuming food containing radionuclides is particularly dangerous. If an individual ingests or inhales a radioactive particle, it continues to irradiate the body as long as it remains radioactive and stays in the body,”said Alan H. Lockwood, MD, a member of the Board of Physicians for Social Responsibility. …the FDA and EPA must enforce existing regulations and guidelines that address radionuclide content in our food supply here at home.”
EPA Statement on Rainwater Results
Elevated levels of radioactive material in rainwater have been expected as a result of the nuclear incident after
the events in Japan since radiation is known to travel in the atmosphere – precipitation data collected by EPA in
the states of California, Idaho and Minnesota have seen elevated levels of radiation in recent precipitation
events.
In all cases these are levels above the normal background levels historically reported in these areas.
While short-term elevations such as these do not raise public health concerns – and the levels seen in rainwater
are expected to be relatively short in duration – the U.S. EPA has taken steps to increase the level of monitoring
of precipitation, drinking water, and other potential exposure routes to continue to verify that.
EPA’s “About the Rainwater Data”
EPA scientists routinely test precipitation samples from more than 30 sites in the U.S. The stations submit
precipitation samples to the EPA lab as rainfall, snow or sleet occurs. Under routine circumstances, samples are
composited and analyzed by EPA scientists monthly. In response to the Japanese nuclear incident, gamma
analyses are being performed on the precipitation samples as they’re received.
It may take up to five days for results because of the number of samples being directed to the laboratory. This is
to ensure the proper analysis and quality assurance measures takes place before the results are released.
EPA expects to see radioisotopes consistent with the Japanese nuclear incident during sample analysis. EPA
expects the measured levels to be extremely low as this air mass disperses across our planet. All results are in
picocuries per liter (pCi/L). A picocurie is one trillionth of a curie.
EPA’s “About the Milk Data”
As part of our efforts to ensure that there is no public health concern in the U.S. related to radiation exposure, EPA routinely samples cow’s milk at more than 30 stations every three months.
EPA has accelerated our quarterly milk sampling across the nation to collect the samples immediately. This action is precautionary, to make sure that we are gathering as much data as possible, informing our scientists and the public.
The milk samples are analyzed by gamma spectrometry, looking for fission products such as iodine-131 (I-131), barium-140 (Ba-140), and cesium-137 (Cs-137), which could become present in the event of a nuclear accident. All results are measured in picocuries per liter (pCi/L). A picocurie is one trillionth of a curie.
EPA’s RADNET TROUBLES
In a previous article it was argued that the EPA’s RadNet radiation detection network suffers from a lack of maintenance, improper calibration and zero credibility. That article also named the company responsible for the proper maintenance of RadNet and showed the political ties that may have helped land the no-bid contract.
A system so essential to informing and protecting Americans during a radiation event fails at a time of need. Why is this? Just how hard is it to maintain what is essentially an Ethernet computer network with a few dozen workstations connected to a radiation sensor and a few servers ?
The “amateurs” over at the Radiation Network set up a simple version of the system with all volunteers in response to the emergency and at last check they were 27 stations strong.
In order to understand the current situation it is necessary to first explore the hows, whats and whys of RadNet.
Air monitoring stations are sited throughout the United States, designed to detect and record various types of airborne radiation. According to the EPA, RadNet provides near real-time monitoring. The RadNet air network uses two different types of monitors, fixed (stationary) and deployable (mobile):
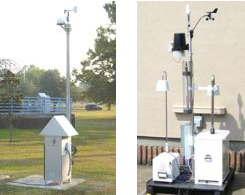
Fixed Air Monitors: Permanently mounted and continuously operating, each fixed monitor contains a high-volume air sampler, gamma and beta radiation detectors, and a computer that controls the monitor and sends data to a central database at least once an hour. The individual detectors within each monitor can discriminate between different types of radiation, including those that are naturally occurring. See the left side of Figure 1.
Deployable Air Monitors: Deployable monitors are portable and can be used for exercises and for rapid deployment in response to real events. The monitors have high- and low-volume air samplers, a gamma radiation level monitor, a data logger, and telecommunication systems that send data to the central database. Although deployable monitors do not discriminate the energy of gamma radiation, they do provide gamma exposure rates. See the right side of Figure 1.
The monitoring stations are in constant contact with a central server through telephone, ethernet, cellular and satellite links depending on the location and circumstances. Collected data is sent to the central server at prescribed intervals and is incorporated into a database that contains data from all stations. Historic and current data can be compared and viewed in numerical or graphical format.
When a monitoring station fails to send data to the server at a prescribed time the software is designed to make a notification.
When a station sends data over a predetermined limit a notification should be sent.
If a self-check of the computer at the station determines there is a malfunction, a notification should also be sent.
This can be accomplished by an entry into a computerized log or an email/page to an on-call technician.
Either none of these notification systems were in place or the EPA knew of the problems and did nothing to resolve them.
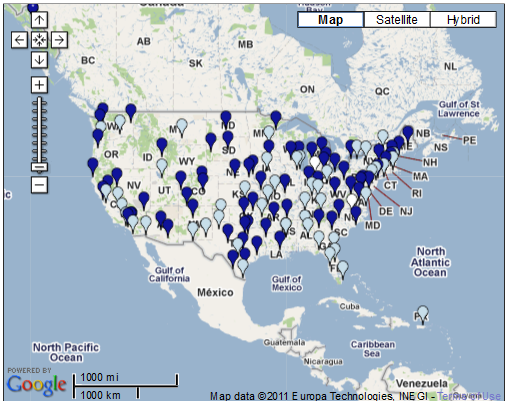
It is evident that the EPA is having a hard time presenting any useful data for the public. A map of fixed stations currently providing useable data downloaded from EPA’s RadNet site on 4/2 shows the following:
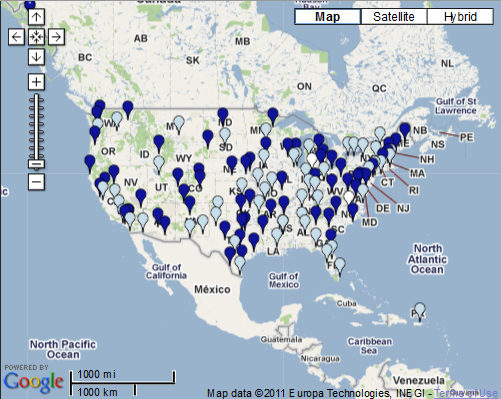
And the same map downloaded on 4/4:
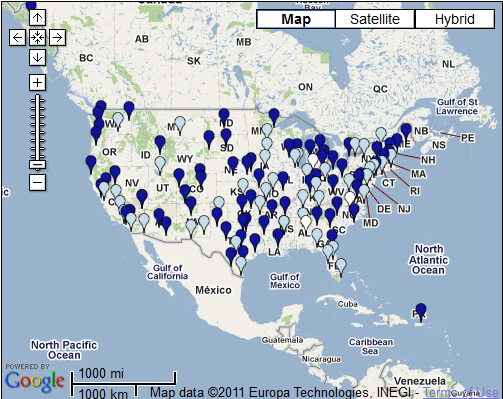
And again on 4/7:
Legend for map color scheme
- Dark blue pins show recently updated data.
- White pins show monitors that are temporarily out of service.
- Light blue pins mean the data is being reviewed at EPA’s National Air and Radiation Environmental Laboratory.
It is evident from the three maps above, downloaded over a period of five days, that there are a high number of stations where “data is being reviewed”. Quite a few are the same stations all three days. The stations in Fort Wayne, Indiana and Raleigh, N.C. have been out of service for multiple days during this period.
During the first week after the radiation started spewing from Fukushima there were almost a dozen stations that were out of service and at least 5 of them were on the west coast. Any attempt to access data from the “online” stations oftentimes resulted in bogus data or no data at all.
Just as disturbing is the EPS’s claim that if a station is offline another nearby station would pick up the slack. The RadNet stations sample air that is available locally. They do not scan at any distance. If a station in Idaho Falls goes offline (which it has) the next nearest station is in Salt Lake City which is 200 miles away. The air nor the weather is the same in these two places.
A section of the EPA RadNet website is devoted to publishing data collected from the stations via quarterly reports, however this has not been done for some time. The first report published at the site is July – September 1991. The last report available on the site is July – September 2009!
According to the site: Environmental Radiation Data (ERD) is an electronic and print journal compiled and distributed quarterly by the Office of Radiation and Indoor Air’s National Air and Radiation Environmental Laboratory (NAREL) in Montgomery, Alabama. It contains data from RadNet (previously known as ERAMS.)
Where is the data from September 2009 to March 2011?
EDI, (the company with the EPA contract to maintain RadNet maintenance) should be investigated and the owners should be held responsible for allowing America to be unprotected from a radiation event such as Fukushima.
RadNet or SadNet? The EPA’s Failed Radiation Detection System
NO-BID MAINTENANCE CONTRACT TO FORMER DEPARTMENT OF DEFENSE UNDER-SECRETARY
SYSTEM NOT READY ON 3/11
RadNet – the EPA’s front-line, radiological detection network is severely flawed and suffers from maintenance and reliability issues.
The lack of consistent data and the number of units offline (a techie term for broken) at the time they were most needed shows that the EPA was not prepared for this emergency.
Besides that fact the broken system left us all unprotected; the confusion, apprehension and fear witnessed as people try to wade through the incomplete and inaccurate data online is evidenced by an exchange on the UC Berkely website over this RadNet graph:
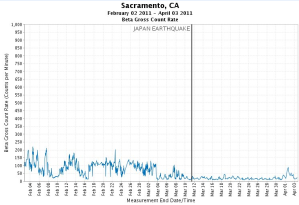
The graph shows that this monitoring station was one of the units actually running on 3/11 . The readings were significantly higher prior to 3/11 and drop to a much lower level afterwards. This is an indication that the units were running in an uncalibrated condition and were adjusted only after the events at Fukushima.
Who is responsible for assuring that the system is up and running? The EPA contracted this responsibility to a private company, Environmental Dimensions, Inc.
Environmental Dimensions, Inc (EDI) has provided maintenance for EPA’s RadNet monitoring systems under a sole source contract which can be viewed at the end of this article. The base amount of the contract is $238,000.00. This does not include materials and travel, which is billed back to the government as needed.
The contract was awarded to what is stated as a “Woman-owned 8(a) Small Disadvantaged Business“. The disadvantaged woman in this case is EDI company president Patricia S. Bradshaw, former Deputy Under Secretary of Defense appointed by George Bush.
Could it possibly be that the corporate management at EDI formed the company not out of an altruistic sense of patriotic duty but to cash in on inside information and connections? Did Mrs. Bradshaw’s former DOD employment open the door? Did the fact that she heads a woman-owned business give her company a competitive edge?
EDI’s revenues have doubled in each of the past three years and they currently have 90 employees spread across offices in Albuquerque, Denver and Oak Ridge.
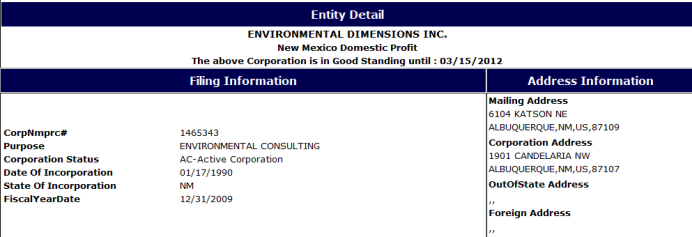
The New Mexico Corporations Division website lists the corporate address as : 1901 CANDELARIA NW ALBUQUERQUE, NM.
A quick Google maps check revealed this building at that location:
This same company also performs radioactive waste remediation and decontamination services for a number of government-funded projects. Do they follow the same cost-cutting, profit-maximizing philosophy as it appears that their maintenance and calibration division practices?
CURRENT NO-BID CONTRACT TO MAINTAIN RADNET MONITORING STATIONS
RADIATION, MILK & IODINE – LATEST EPA TESTING RESULTS
The FDA announced on March, 30 that results from a screening sample taken March 25 from Spokane, Wash. detected 0.8 pCi/L of iodine-131, which is more than 5,000 times lower than the Derived Intervention Level (DIL) set by the U.S. Food and Drug Administration.
In light of that and the eventual elevation of levels as the Fukushima reactor continues to spew radioactive materials into the atmosphere, I have compiled the information below. This information will be updated as events warrant. Check the end of this article for updates and new links.
EPA RadNet Milk Results Latest Published Data
Exposure
Internal exposure by ingestion of radioactive iodine (I-131 ) occurs when persons eat food that is contaminated with the fallout. The oral pathway is the main route of internal I-131 exposure for people. Milk is the major source of internal exposure. I-131 is radioactive, has an 8.03 day half-life, and emits beta and gamma radiation.
The thyroid gland is the critical organ for I-131 exposure. Essentially all of the iodine entering the body quickly becomes systemic (EPA 1988), with approximately 30% depositing in the thyroid. Dietary intake of iodine before exposure is important because a relative iodine deficiency increases the thyroid uptake of I-131.
After cow’s graze on grass that has been contaminated by radioactive fallout, glands in the cow’s udder concentrate the radioactive iodine and release it into the milk. Goat’s milk and sheep’s milk contain approximately 10 times the concentration of radioiodine found in cow’s milk.
After exposure, the most critical dietary information needed is the amount and type of milk and milk products consumed, their I-131 concentrations, and the time they were consumed relative to the time of the release.
Inhalation, especially near releases of I-131 in the absence of rain, is another route of internal exposure. However, doses to humans from inhalation and from ingestion of plants, animals, or water are usually small in comparison. Figure 1 shows the exposure pathways of I-131 from the environment to humans.
FDA RADIOACTIVE CONTAMINATION OF HUMAN
FOOD AND ANIMAL FEEDS GUIDELINES
“A temporary embargo to prevent the introduction into commerce of food from a contaminated area should be considered when the amount of contamination equals or exceeds the DILs or when the presence of contamination is confirmed, but the concentrations are not yet known. The temporary embargo would continue until measurements confirm that concentrations are below the DILs.
Normal food production and processing procedures that could reduce the amount of radioactive contamination in or on the food could be simple, (such as holding to allow for radioactive decay, or removal of surface contamination by brushing, washing, or peeling) or could be complex. The blending of contaminated food with uncontaminated food is not permitted because this is a violation of the Federal Food, Drug and Cosmetic Act (FDA 1991).”
Natural Sources of Iodine
Normally, your body stores between 20 to 30 mg of iodine, most of which is kept in the thyroid gland. While iodine deficiency was a problem in the early 20th century, the inclusion of iodine in iodized salt has nearly eradicated the problem. Also, because it is often added to animal feed, iodine is passed onto humans through cow’s milk.
Iodine is also found naturally in many foods, but it has the highest concentration in  kelp, yogurt, cow’s milk, eggs, strawberries and mozzarella cheese.
Iodine-131 may not be the only concern in the future if the slightly heavier and longer-lasting isotopes experienced after Chernobyl make it across the Pacific. The food monitoring results from FDA and others following the Chernobyl accident support the conclusion that I-131, Sr-90, Cs-134 and Cs-137 are the principal radio-nuclides that contribute to radiation dose by ingestion following a nuclear reactor accident, but that Ru-103 and Ru-l06 also should be included.
Nat’l Cancer Institute – Get The Facts About I-131
LATEST EPA RADNET MILK INFO:
EPA RadNet Milk Results Latest Published Data
Radiation from Japan has been detected in drinking water in 13 more American cities, and for the first time cesium-137 has been found in American milk—in Montpelier, Vermont, according to data released by the Environmental Protection Agency late Friday. The sample contained 1.9 picoCuries per liter of cesium-137, which is under EPA’s 3.0 picoCuries per liter standard.
Milk samples from Phoenix and Los Angeles contained iodine-131 at levels roughly equal to the maximum contaminant level permitted by EPA, the data shows. The Phoenix sample contained 3.2 picoCuries per liter of iodine-131. The Los Angeles sample contained 2.9.
The EPA maximum contaminant level is 3.0, but this is a conservative standard designed to minimize exposure over a lifetime, so EPA does not consider these levels to pose a health threat.
Airborne contamination continues to cross the western states, the new data shows, and Boise has seen the highest concentrations of radioactive isotopes in rain so far.
A rainwater sample collected in Boise on March 27 contained 390 picocures per liter of iodine-131, plus 41 of cesium-134 and 36 of cesium-137. EPA released this result for the first time yesterday. Typically several days pass between sample collection and data release because of the time required to collect, transport and analyze the samples.

